XML Documents in Networked Economy

Storing and processing CAE documents in XML format is a dominating  archival solution because it is in full compliance with the requirements of networked economy.

The chief challenge in networked economy today is the integration of all available documents into one unified computational environment that works in the Web information space. The Web-driven CAE system is an n-tier architecture where distributed computers with different run-time environment and engineering software communicate with each other by exchanging  XML documents. Significant policy in enterprise integration is to present the documents in XML form.

Converting conventional documents into XML document. Software agents need to access engineering documents that were built in different nodes for use in unanticipated contexts.

The first step for the designers is to mark up manually various conventional documents, database tables, messages from mobile devices and sensors, etc. Using these mark-ups, the information Web services and activated agents can interpret and reason with the information as shown in Figure 4. Establishing semantics over the marked-up information pathways plays a key role for numerous engineering tasks such as comparing models to understand the semantic differences, mapping terms and entities to ensure product data integration, or simply reusing entities and queries to product data to prevent duplication of work.

XML-based languages in CAE. Engineering societies in all areas create XML variants of the design and manufacturing languages. Here are the dominating in the mechanical and electronic industry:

  • STEP  (Standard for Exchange of Product model data)  provides a mechanism that is capable of describing product data throughout the life cycle of a product, independent from any particular system. The nature of this description makes it suitable not only for neutral file exchange, but also as a basis for implementing and sharing product databases and archiving;
  • The Process Specification Language (PSL) defines a neutral representation for manufacturing processes that supports automated reasoning. Process data is used throughout the life cycle of a product, from early indications of manufacturing process flagged during design, through process planning, validation, production scheduling and control.
  • The Systems Modeling Language (SML) is a general-purpose graphical modeling language for specifying, analyzing, designing, and verifying complex systems that may include hardware, software, information, personnel, procedures, and facilities. In particular, the language provides graphical representations with a semantic foundation for modeling system requirements, behavior, structure, and parametric, which is used to integrate with other engineering analysis models.
  • Electronic Business XML provides an open, XML-based infrastructure that enables the global use of electronic business information in an interoperable, secure, and consistent manner by all trading partners. The ebXML architecture is a unique set of concepts; part theoretical and part implemented in the existing ebXML standards work.
  • Mathematical Markup Language (MathML) has been designed to encode mathematical material suitable for teaching and scientific communication at all levels providing both mathematical notation and mathematical meaning.  It facilitates conversion to and from other math formats, both presentational and semantic and  allows the passing of information intended for specific renderers and applications.  It also supports efficient browsing for lengthy expressions and it is suited to template and other math editing techniques. The MathML is human legible and simple for software to generate and process.
  • Materials Markup Language enhance the e-business needs of materials producers, designers, fabricators, quality assurance, and failure analysis specialists by developing an XML-based standard markup language for the exchange of all types of materials technical information, while retaining its high quality and integrity despite its complexity.
Implementing Application Monitoring

Early planning is the best way to start an implementation of monitoring. Planning early allows for the monitoring to be added into the application at the time development instead of a later time. Adding monitoring later in the process tends to focus on only areas of known issues, this may allow some issues to go undetected.

Implementing Application Monitoring Proactively

Proactive application monitoring is the hardest monitoring to implement. In proactive application monitoring the problems are found and dealt with before the consumer even knows there is a problem. This involves monitoring very deep and specifically into the application. This way if an error does happen, the system knows exactly where it occurred and what caused it. [1]

The best approach to proactive monitoring involves a tools based approach. With a tools based approach the monitoring involves no code. This is the best advantage to this approach, allowing for the collection of data to be very easily and readily set up. This is done through class loader instrumentation. This also means that the tools aren’t specific to a single application and can be reused across multiple applications of the same language. The other approach is a code based approach where logging and or monitoring software is inserted directly into the code base during development or by the support team thereafter the initial development. This approach is less efficient as the developers have less time to spend on logic within the program since they have to worry about how to monitor it as well.

Implementing Application Monitoring: Create a Recovery Plan

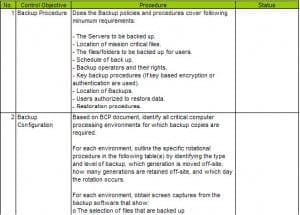
Having a recovery plan in place is vital to a fast resolution of an issue. Overtime applications may migrate to different support groups. Having a recovery plan with common issues and their fixes helps the teams stay current. An example on how to create a recovery plan is displayed in Figure 1 courtesy of a free spreadsheet available from the website governancesforum.com.

Implementing Application Monitoring

Figure 1: Recovery Plan Template

Implementing Application Monitoring: Create and Use Service Level Agreements

Even if the service level agreement is unofficial it still is worthwhile to have a structure in place.

Service level agreements include items such as the following:

  • What percentage of time that the services will be up (uptime)
  • How many people can use the application at once without performance issues
  • Performance metrics and benchmarks to be used with performance monitoring alerts
  • The rules for notification announcements
  • What statistics will be monitored and when and where they will be available
  • Acceptable response time

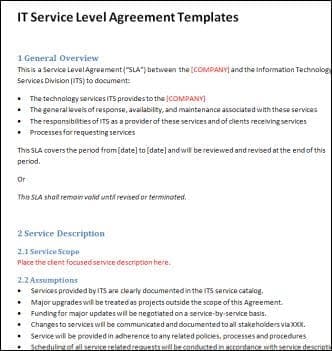
An Example of an SLA is given in Figure 2.


Service-Level-Agreements-SLA

Figure 2: Example of SLA


Application Monitoring Challenges

Various types of systems cause many different challenges in monitoring of the applications. Each system has a different setup on or off of servers. Some systems may be virtualized and not have access to a shared drive where logs can be stored. The most common types of systems include shared systems and clustered systems. Another major challenge of application monitoring is production logging. Since systems may already be in a production environment, implementing logging may come at a considerable price.  

Shared Systems 

This is a major challenge for application monitoring. Monitoring an application on its own system allows for ease of tracking statistics such as memory usage, disk space, CPU usage and network bandwidth. Most applications however share a common system on which they share all of the above. This makes tracking usage of each system difficult and may lead to applications being impacted for no fault of their own. If the application is on a shared system which the developer/owner of the application does not own it may be difficult to make the corrective actions. 

Clustered Systems 

Clustered systems are used to avoid a single point of failure. This is the act of using multiple machines in different areas of the network to avoid the point of failure. This is challenging to monitor because in order to find which system is causing the shortfall, all logs must be parsed to see which is having the bad performance. Also depending on the type of cluster there may be a main server which controls all the other servers which also needs to be monitored. If the main server were to crash all others would be rendered useless. 

Production Logging 

Production logging is generally limited since file input and output is very time consuming. Some high volume transaction applications may have tight threshold levels and custom production logging may bring them below those levels. If an error cannot be repeated in a test environment there may need to be changes deployed to production to catch and handle/log the error more specifically. Updating a production operation requires downtime of the application in many cases. This downtime may not be acceptable and could cause a loss of profit for the company.

Solving Network Problems

Preventing Problems with Network-Management and Planning

  1. The two ways to solving network problems are: pre-emptive troubleshooting and troubleshooting. In a perfect world, we would be able to prevent problems before they occur (pre-emptive troubleshooting), however, network administrators often find themselves repairing problems that already exist (troubleshooting).
  2. Policies and procedures should be applied during the planning stages of a network as well as throughout the network’s life. Tasks that should be included in such policies are: back-up methods, security, hardware and software standards, upgrade guidelines, and documentation

Solving Network Problems

Backing Up Network Data

  1. To formulate any back-up plan, consider the following topics and issues:
    • Determine what data should be backed up as well as how often.  Some files seldom change and may require backup only weekly or monthly.
    • Develop a schedule for backing up your data that includes the type of backup to be performed, how often, and at what time of the day.
    • Identify the person(s) responsible for performing backups.
    • Test your back-up system regularly.

Setting Security Policies

  1. Security policies vary based on sensitivity of data, network size, and the company’s security standards. Once the detailed policy has been outlined in a network plan it should be followed closely in order to be effective.
  2. Security policy should not only include data security, but hardware security as well. If file server or other networking equipment is in a common area that anyone can access, security can easily be compromised.
  3. Special security requirements may be necessary for dial-in users.
  4. One of the most important security considerations is who should be granted network administrative access to the network. The more people who have this level of access, the more likely security problems will occur.

Setting Hardware and Software Standards

  1. It is very important to implement hardware and software standards. Since administrators are responsible for supporting networks, which includes hardware and software, administrators should be involved in deciding what hardware and software will be permitted on the network.
  2. Standards should be defined for desktop computers (standards for several levels of users might be necessary), networking devices, and server configurations.
  3. Regular evaluations of standards help ensure that your network does not become outdated.

Establishing Upgrade Guidelines

  1. Upgrading computer and networking technologies is a never-ending task. Establishing upgrade guidelines will help make the process easier.
  2. Always give users advance notice so that they know changes will take place and can respond to them.  Additionally, disruptive upgrades should not be performed during normal working hours. A plan should be included on “undoing” an upgrade.

Maintaining Documentation

  1. Documentation is often viewed as the most boring and time-consuming aspect of an administrator’s duties, however, it can be one of the most important elements of troubleshooting and solving network problems. A well-documented network is much easier to troubleshoot than a network with very little documentation.
  2. If you work in a networking environment that encompasses multiple LANs, each LAN should have its own set of documentation. One of the most important lists is the address list. If a specific device is causing a problem on a network, it will most likely be identified by a MAC or IP address. If an updated address list is kept, location of a particular device is easily identified. An address list is an example of a list that can be kept as a database.
  3. Documentation should be kept in both hard copy and electronic form so that it is readily accessible. When information is updated, it should be documented on both forms of documentation.


Performing Pre-emptive Troubleshooting

  1. Pre-emptive troubleshooting saves time, prevents equipment problems, and ensures data security. More importantly, it can save a lot of frustration when trying to identify the cause of problems.
  2. The five ISO pre-emptive troubleshooting network-management categories are: accounting management, configuration management, fault management, performance management, and security management.

Practicing Good Customer-Relation Skills

  1. Users are customers and your customers are your best source of information when something goes wrong. It is extremely important to build good relationships with users.

Using Network-Monitoring Utilities

  1. It is important to establish a baseline of “normal” networking activity. This baseline can be used to identify when the network is acting “abnormally”.
  2. Network monitoring utilities gather the following information: Events, system usage statistics, and system performance statistics.
  3. Some of the specific network aspects that a baseline can be helpful in monitoring are: daily network utilization patterns, possible bottlenecks, heavy usage patterns, and protocol traffic patterns. This information is obviously very useful. For example, if utilization levels are constantly measured at 60% or greater, it’s time to look at an upgrade.
  4. SNMP is part of the TCP/IP protocol suite and it is used to manage a monitor device. Agents are used to gather information that is stored in a management information base (MIB).
  5. RMON is an advanced network monitoring protocol that extends the capabilities of SNMP. The two versions of RMON are: RMON1 and RMON2


Solving Network Problems: Network Troubleshooting

  1. Troubleshooting is often a learned skill instead of a skill that can be taught. However, there is a methodology that can be followed to help in troubleshooting problems.
  1. The following set of steps helps you troubleshoot most common networking problems:
    • Eliminate any potential user errors.
    • Verify that physical connections are indeed working.
    • Verify the status of any suspect NICs.
    • Restart the computer.


Structured Approach

  1. Sometimes even if the basic steps are followed, a more detailed approach might be necessary.
  2. The five-steps of the structured troubleshooting approach: prioritize, collect information, establish possible causes, isolate the problem, and test results.
  3. When collecting information, network administrators should find out as much information as they can by asking specific questions, such as those listed in the text.
  4. Once possible causes are identified, the most likely cause should be tested first. It is important to understand that only one change should be implemented at a time. If a technician tries several changes before testing each one, he/she will not know for sure which change solved the problem. Also, the technician may have fixed the original problem, but cause another one with an unnecessary change.


Using Special Tools


  1. There is more to troubleshooting than instincts and experience. Sometimes special tools are essential in solving problems.
  2. Some of the most common problems found in networks involve the physical cabling. A digital voltmeter (DVM) can measure a cable’s resistance and determine if a cable break has occurred.
  3. A TDR can also determine if a cable is broken. The difference between a TDR and DVM is that a TDR can pinpoint the exact location of the cable break. TDR devices are an expensive device, but can be rented at minimal cost.
  4. Basic cable testers are inexpensive, but typically can only test correct termination of twisted-pair cabling. Advanced cable testers can measure impedance, resistance, attenuation, and length.
  5. Oscilloscopes can be used to identify shorts, sharp bends or crimps, cable breaks, and attenuation problems.
  6. Network monitors evaluate the overall health of a network by monitoring all traffic. These programs can generate reports and graphs based on the data collected.
  7. Protocol analyzers combine hardware and software to provide the most advanced network troubleshooting available. This tool not only monitors traffic in real time but also can capture and decode packets.


Network Support Resources


  1. Microsoft TechNet is a subscription information service for supporting all aspects of networking. It can be an essential tool when supporting a Microsoft-based network.
  2. If a subscription to Microsoft TechNet is too expensive, Microsoft offers a free support service known as Microsoft Knowledge Base on their web site. It will not offer as much information as the TechNet subscription.
  3. There are support services offered by Linux and Novell NetWare. Many of these sites provide articles about known problems, workarounds and downloads of upgrades and bug fixes.
  4. There are also many online support services that allow you to tap into the knowledge of experienced networking professionals. Additionally, many of the networking periodicals are now available online as well.


Common Troubleshooting Situations


  1. Cabling and faulty NICs cause some of the more common network problems.

Program Performance Monitoring System

Program Performance Monitoring System

NIH seeks high efficiency and accountability in its research portfolio performance management.  Mandated by the U.S. Government Performance Results Act legislation, NIH developed a systematic approach of collecting performance information to articulate program goals and provide information on performance monitoring.  Under GPRA, NIH has one program – Research.

As the nation’s major biomedical research agency, NIH manages a vast and complex research portfolio.  The size of the research portfolio created the need for a systematic data collection IT tool for gathering evidence on performance relative to program objectives, effectiveness, and efficiency.  NIH also recognized the need for a centralized automated portal system that could harvest the vast performance information and make it available to stakeholders and decision-makers in a timely manner and in ways that can aid communication and planning.  Such objectives guided SAB in the development of NIH’s first Program Performance Monitoring System (PPMS), a centralized secure online performance storage and monitoring system for collecting, organizing, and analyzing performance data.

PPMS is the collaborative knowledge portal for NIH performance information.  The system provides an anthology of performance information that can be used to develop and support organizational annual planning and assessing budget-performance integration.  PPMS serves as NIH’s program performance portfolio management and evaluation tool.  The system was built to link to relevant performance resources, and was designed not to duplicate existing systems.  PPMS consist of a Website (http://nihperformance.nih.gov) and the online performance reporting Visual Performance Suite (VPS) database application. The Website links to relevant NIH systemic assessments resources to provide sufficient access to general performance information at NIH.  VPS, the key feature of the Website, provides a Web-enabled centralized performance reporting database that is used to collect, store, and report GPRA and PART performance data for NIH projects.  NIH decision-makers are able to use the data for planning and performance monitoring.

Website 

The NIH performance monitoring Website enables the general public access to the centralized collection of NIH performance, database links, and publicly released NIH-specific performance reports and news.  The site organizes data and provides information relevant to the GPRA, PART, PAR and other program performance activities across NIH.  The PPMS Website is comprised of two Web-based servers: one is an unsecured public gateway to NIH performance monitoring information, and the other is a highly secured intranet server for authorized NIH users who participate in performance activities across the agency.  The sensitive and critical nature of the information stored within, processed by, or transmitted by some portions of the Website was a major concern in risk management.  This concern led to the construction of a security plan that would ensure the identification and implementation of management, technical, environmental, and operational controls commensurate with the sensitivity of the information and criticality of the application.  The PPMS Webpage has been designed to accommodate the following three user roles:

  1. Shadow Users – also known as public users – is designed for users outside the NIH firewall. Users are only allowed access to non-sensitive content.
  2. Standard Users – view designed specifically for individuals within the NIH firewall.  Users have access to the public view and the VPS tool set, and are permitted to perform data entry and generate reports within the VPS environment.
  3. Special User – User role is specifically for NIH Senior Management to view graphics and reports related to NIH performance data.

The public server contains a virtual warehouse that stores numerous NIH performance data sources.  Public users who are not authenticated to be data users within the reporting system can browse through a centralized collection of published NIH-specific performance reports and NIH-wide database links.  The site contains federal and agency-wide program performance information that allows users to ascertain the relative effectiveness of NIH performance on its research programs.

The secure site contains a performance library that includes numerous sources such as press releases and narratives of scientific advances.  The system enables users to search within NIH and across specific performance indicators. For example, if a user selects “AIDS” as a search topic in the PubMed search engine on the Website and “NIH press releases” as the source, they can obtain all NIH press releases related to AIDS.  The Website also provides links to the external performance and budget data reporting VPS system.  It uses a single sign-on role-based entry access to enter the VPS site.  When a user within the NIH system firewalls navigates to the PPMS Website, the security system examines user criteria and grants access to the appropriate information based on appropriate authority rules.  The single access log-in feature provides a useful and convenient way for all agency users to have instant access to all NIH applications by entering user login and password only once.  On the secure site, standard users have the capability of entering performance data online directly into the VPS system.  The users are able to communicate strategically and use the automated data collection tool to make performance data transparent to collaborators.  The special users have the capability to view performance graphic based on data entered in the system and generate analytic reports to evaluate the programs.  The content of the secure Webpage are summarized in Table 1.

Performance Management and the Government

Application Performance Government

The National Institutes of Health (NIH), a part of the U.S. Department of Health and Human Services (HHS), is the primary federal agency for supporting and conducting biomedical research.  Composed of 27 Institutes and Centers (ICs), NIH conducts and supports basic, clinical, and translational medical research, and investigates the causes, treatments, and cures for both common and rare diseases.  NIH’s research portfolio is extensive and complex, and presents many challenges to program evaluation and portfolio management.  Portfolio management is critical to NIH’s efforts to sustain and to advance the excellence and relevance of its research programs in order to be dynamic and responsive to new medical information, emerging scientific opportunities, and public health needs.

U.S. government programs are under increasing pressure to become more transparent with its program performance and finances.  Under this agenda, all government agencies are held accountable for meeting agency performance goals and annual targets.  To make sure programs achieve this objective annually, government initiatives, such as the ones listed below have been established to capture performance information and to evaluate programs across all government agencies in the United States.

  • Government Performance Results Act (GPRA) – Federal statute mandating performance-budget information reporting.
  • Program Assessment Rating Tool (PART) – A systematic method of assessing the performance of program activities across the federal government.  PART is also described as a diagnostic tool used to improve program performance.
  • Performance and Accountability Report (PAR) Act – PAR implements a process of program review and evaluation to determine the strengths and weaknesses of federal programs with a particular focus on the results produced by individual programs.

To fulfill the above requirements, NIH has a set of core criteria in planning and assessing organizational performance goals:

  • Time (short, mid-range and long-term)
  • Scientific Risk (low, medium and high)
  • Trans-NIH approach (across Institutes, Offices and Centers)
  • Balanced scientific research portfolio (intramural and extramural science activities)
  • Representative sampling (across diseases, disorders, and management issues)
  • Annual performance target and budget monitoring

To comply with government performance-based program reporting requirements, NIH has developed a systematic approach of collecting performance and budget information across ICs to articulate program goals and provide information on performance monitoring.  The NIH Systemic Assessments Branch (SAB) of the Office of Portfolio Analysis and Strategic Initiatives (OPASI) under the Office of the Director addresses government performance mandates and liaises with ICs to collect, plan, measure and evaluate NIH performance information.

The former process of reporting performance information at NIH required extensive communication between the Planning and Evaluation (P&E) community and SAB on a regular basis with monthly meetings, working groups, and numerous exchanges of email.  SAB program staff and IC officers followed a series of manual tasks and activities to gather, review, consolidate and publish paper-based reporting materials to meet performance reporting requirements.  To prepare for the creation of reports, annual data were reviewed, revised, annotated when necessary, and published in a series of paper-based reports communicated through a series of emails.  Such a process, when multiplied over the various Institutes, Centers, and Offices at NIH, represents a substantial loss in productivity and a high risk of error in the performance reporting.  It was difficult to maintain the currency of the information. The email-based communication and the reliance on Microsoft Word and Excel for reporting were not efficient and did not meet the performance reporting needs of NIH.  The implementation of the centralized PPMS application allows for distributed content management, providing a more useful tool for knowledge management of performance information, while allowing performance goal leads and contributors a single point of access to a centralized repository of needed information.